What are the differences in NHS waiting times under Labour and Conservative governments

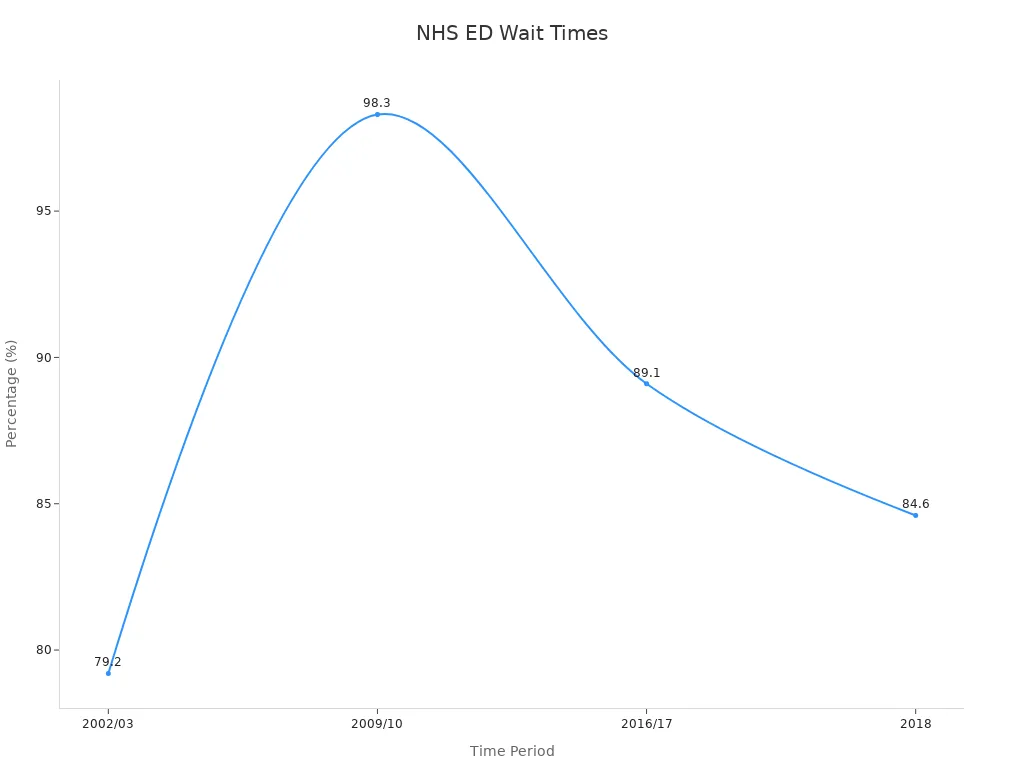
NHS waiting times have varied significantly depending on the party in government, with the debate over NHS waiting times Labour vs Conservative becoming increasingly prominent. Under Labour, NHS waiting lists reached their shortest levels ever recorded. For example, inpatient waiting times fell from 12.9 weeks in 2000 to just 4.3 weeks by 2010. Outpatient waiting times were almost halved within five years. By 2010, 98% of patients attending A&E were seen within four hours. In contrast, under the Conservative government, waiting lists have lengthened. The issue of NHS waiting times Labour vs Conservative is now a major concern for many voters in this election, as people are demanding swifter NHS care in the future.
Indicator | 2000/2003 | 2010 | Change Description |
|---|---|---|---|
Median inpatient waiting time | 12.9 weeks | 4.3 weeks | Reduced by two-thirds |
Median outpatient waiting time | ~5.4 weeks | 2.7 weeks | Almost halved in 5 years |
Percentage treated in A&E < 4 hours | 78% | 98% | Increased by 20 percentage points |
Key Takeaways
Labour governments made NHS waiting times much shorter. This meant patients got care faster and did not wait as long.
Conservative governments saw NHS waiting lists become almost three times bigger. This made people wait longer and put more stress on services.
Labour used clear goals and gave more money to the NHS. This helped them cut waiting times and made patients happier.
When the Conservatives were in charge, there were not enough staff and less money. This meant they missed their goals and people trusted them less.
Pictures and charts show how government choices change NHS waiting times and how patients feel.
Overview
NHS Waiting Times Labour vs Conservative
The question about nhs waiting times labour vs conservative is very important in this election. Labour governments made nhs waiting lists the shortest ever. By 2010, people waited only 4.3 weeks for inpatient care. Almost everyone in A&E got help within four hours. When the Conservatives took over, nhs waiting lists got much longer. The number of people waiting for hospital treatment in England went from 2.6 million in 2010 to 7.6 million in 2024. This means the waiting lists are now almost three times bigger than before.
Indicator | Labour Government Period (up to 2010) | Conservative Government Period (2010-2024) |
|---|---|---|
% of patients waiting more than 4 hours in emergency departments | 3.9% (2010-11) | 24.6% (2019-20), 41.9% (2023-24) |
% of patients starting consultant-led treatment within 18 weeks of GP referral | Met target of ≥92% | Routinely missed for nearly a decade |
Public satisfaction with the NHS | 70% (2010) | Fell to 24% (2023) |
When you compare nhs waiting times labour vs conservative, Labour had shorter waits and people were happier. Conservative governments have not met targets, and fewer people trust the nhs now.
Note: The nhs waiting lists in England are now 7.6 million. Under Labour, it was 2.6 million. This big increase means patients wait longer and nhs services are under more stress.
Key Differences
The biggest differences in nhs waiting times labour vs conservative are in how long people wait and how they feel about care. Labour governments made waiting lists shorter and helped people get care faster. Conservative governments have seen waiting lists get longer and targets missed.
NHS waiting lists in England are almost three times bigger since 2010.
Median waiting times for planned treatment went from 4.3 weeks in 2010 to over 22 weeks in 2024.
The share of patients seen in A&E within four hours dropped from 98% in 2010 to less than 60% in some months of 2023-24.
Public satisfaction with the nhs fell from 70% under Labour to 24% under Conservative governments.
NHS waiting times labour vs conservative data also show differences in the UK. Scotland has shorter waiting lists than England. Wales and Northern Ireland have even longer waits. In England, about 1 in 150 people on waiting lists wait over a year for treatment. In Wales, about 1 in 20 people wait that long.
The rise in nhs waiting lists under Conservative governments is linked to less money, not enough staff, and more people needing care. Experts say long waits can make things worse for patients, especially in emergencies.
NHS waiting times labour vs conservative comparisons show a clear pattern. Labour governments gave people shorter waits and higher satisfaction. Conservative governments have seen waiting lists and waiting times go up. This is a big issue in the election, as people want better nhs care.
Labour Record
NHS Waiting Times
Labour governments wanted to make NHS waiting times shorter. They set clear goals and spent money on new staff and equipment. By 2008, Labour said most patients should wait no more than 18 weeks from GP referral to treatment. Hospitals in England reached this goal. Patients noticed they got care faster.
The main data for these results comes from Hospital Episode Statistics (HES) and the 2001 Census. Researchers like Cooper et al. (2009) used this information to check waiting times for treatments like hip replacements. Their study found that most patients waited less time, but some hospitals and groups still had longer waits. Using HES and deprivation indices gave a full and trustworthy view of NHS performance during Labour years.
Hospital Episode Statistics (HES) data from 2001 linked with Census deprivation indices
Cooper et al. (2009) study on elective hip replacement waiting times
Study found waiting times dropped, but some areas had longer waits
Data showed most differences happened inside hospitals, not between them
NHS Waiting Lists
Labour governments worked to make waiting lists shorter and help people get treatment sooner. They cut the longest inpatient wait from over 18 months to under 6 months between 1997 and 2004. Outpatient waits also went down from 6 months to 3 months. By 2010, the middle wait for inpatient care was only 4.3 weeks.
Period | Waiting Time Metric | Numerical Data / Target |
|---|---|---|
1997-2000 | Maximum inpatient waiting time | |
1997-2000 | Reduction in total inpatient waiting list | Decreased by 100,000 patients |
2000-2004 | Maximum inpatient and day-case treatment | Reduced from 18 months to 6 months |
2000-2004 | Maximum outpatient appointment wait | Reduced from 6 months to 3 months |
2005-2008 | Referral to treatment waiting time target | Set at maximum 18 weeks |
Labour made NHS waiting lists the shortest ever. Their work to cut waiting lists meant more people got help faster. Labour governments used targets, more money, and better management to get these results.
Labour’s record shows that setting clear goals and spending money can make waiting times shorter and help patients get treatment faster.
Conservative Record
NHS Waiting Times
Since 2010, Conservative governments have had more problems with NHS waiting times. Hospitals have not been able to hit important targets. The NHS has not reached the goal of treating or admitting 95% of A&E patients within four hours since July 2015. In the last few years, only about 83.6% of patients got care in this time. The target for starting consultant-led treatment within 18 weeks has also not been met for almost ten years. In September, just 84.8% of patients started treatment within the target time.
Many hospitals are now always full. There are not enough beds, so more patients wait on trolleys. Sometimes, this number is 80,000 or even higher. Not enough staff and not enough money have made things worse. The NHS has fewer beds than other similar countries. Staff vacancies have gone up from 7.9% in 2021 to 9.7% in 2022. Many doctors leave for better pay in other countries, which makes the problem bigger.
Experts say that more people needing care and an older population have made things harder. Cuts to social care have also added to the problem. The Institute for Fiscal Studies thinks NHS waiting times may not get back to normal until at least 2030.
NHS Waiting Lists
NHS waiting lists have grown a lot under Conservative governments. In December 2019, 4.6 million people were waiting for treatment. By January 2024, this number was almost 7.58 million, with 6.3 million different patients. The NHS has not met the 62-day cancer treatment referral target since September 2015. In early 2024, only 62.3% of patients got treatment in this time, much lower than the 85% goal.
A table below shows how waiting lists and missed targets have gone up:
Year | Total NHS Waiting Lists | % Treated in 18 Weeks | % Cancer Patients Treated in 62 Days |
|---|---|---|---|
2012 | 2.5 million | 92% | 85% |
2019 | 4.6 million | 84.8% | 77% |
2024 | 7.58 million | 78% | 62.3% |
Not enough staff and not enough money for buildings have made waiting times longer. The NHS needed £33 billion more between 2010 and 2019 to be like other European countries. Even though funding went up, spending was still 18% less than the EU14 average. People are less happy with the NHS now, as they are upset about longer waits and missed targets.
Influencing Factors
Funding and Policy
Funding and policy choices have had a big effect on NHS waiting times. When Labour was in charge, the NHS got more money for ten years. This extra money meant more staff, new equipment, and shorter waits for care. Reports show that from 1997 to 2010, the NHS got more money each year. This helped the NHS reach its goals and keep waiting lists low.
After 2010, Conservative governments made the NHS save £20 billion. This meant less money for the NHS and no new investment. Because of this, hospitals had less money, fewer beds, and longer waits. Later, the government promised more money, like the £20 billion in 2018. But this money often came too late or was not enough for the growing number of patients. These changes made it hard for the NHS to keep up, especially when elections made funding a big topic.
Policy choices also changed waiting times. Labour set rules for how long people should wait and gave rewards or punishments to hospitals. This made treatment faster, but sometimes staff cared more about targets than patients. Some studies found that hospitals tried to avoid punishments by changing how they reported results, which could change what care was given.
Management and Pressures
How the NHS is managed and outside pressures have also changed how well it works. Hospitals felt pressure from leaders to show better waiting list numbers. Sometimes, this made them report numbers that were not correct or change what care was given to meet targets.
Hospitals sometimes gave wrong waiting list numbers because of pressure.
Governments changed how they counted waiting times, so results are hard to compare.
Leaders used waiting list numbers to help in elections.
NHS managers had to meet tough targets, sometimes instead of using their own judgement.
The government used private companies to help cut waiting lists.
Research shows that good management can help, but NHS managers do not have much freedom because of strict rules. More people needing care and not enough staff have made things harder. All these choices about money, rules, and management have shaped NHS waiting times today.
Data Comparison
NHS Waiting Times Trends
Visual data tools help people see changes in NHS waiting times. Bar charts and line graphs show if waiting times go up or down. These tools make it simple to spot when waits got shorter or longer. For example, a line graph for elective surgery from 1997 to 2019 shows a big drop during Labour years. After 2010, waiting times started to rise again. NHS Wales data also tracks emergency department waits. Since 2012-13, the median wait time has gone up by 40%. The longest waits were in 2022-23, with older patients waiting over eight hours.
Year/Period | Median Waiting Time (weeks) | Political Period |
|---|---|---|
2000 | 12.9 | Labour |
2010 | 4.3 | Labour |
2019 | 8.5 | Conservative |
2024 | 22+ | Conservative |
Line graphs and bar charts help people see how patient waiting times have changed. These visuals show how policy and funding choices affect waiting times.
Statistical studies use data from GP practices and hospitals to see how waiting times affect demand for nhs treatment. These studies show that longer waits mean more patients wait for care. Policy changes after 2010, like austerity, made waits longer, especially in poorer areas.
NHS Waiting Lists Data
Tables and dashboards give a clear view of how many people are waiting for treatment. Under Labour, waiting lists fell to 2.6 million by 2010. Under Conservative governments, the number rose to 7.6 million by 2024. This means more patients are waiting for nhs treatment now than before.
Year | Total Waiting List (England) | % Waiting Over 18 Weeks | % Cancer Patients Treated in 62 Days |
|---|---|---|---|
2010 | 2.6 million | 92% treated in time | 85% |
2019 | 4.6 million | 84.8% | 77% |
2024 | 7.6 million | 78% | 62.3% |
Bullet charts and dashboards show how many beds are full and how many staff are working. These visuals make it clear when hospitals are struggling.
Diverging bar charts show patient satisfaction, which dropped from 70% in 2010 to 24% in 2023.
The biggest change is the size of the waiting list. More people waiting for treatment means longer delays and more stress for patients. Visual data makes these trends easy to see and understand.
NHS waiting times and waiting lists changed a lot with each government. Labour governments made long waits for operations much shorter, from almost 284,000 to less than 200. They also made A&E care better, so nearly everyone was seen in four hours. Under Conservative governments, waiting lists grew to over 7 million. Many people had to wait more than a year for treatment. Now, patients have longer delays and NHS services are under more pressure. People should think about these facts when choosing which party helps the NHS most.
FAQ
What are NHS waiting times?
NHS waiting times show how long patients wait for treatment or appointments. These times help people understand how quickly the NHS provides care. Shorter waiting times mean patients get help faster.
What caused NHS waiting lists to rise under Conservative governments?
Experts link rising waiting lists to funding pressures, staff shortages, and higher demand. The NHS received less money compared to earlier years. Hospitals struggled to keep up with more patients.
What did Labour do to reduce NHS waiting times?
Labour set strict targets and increased NHS funding. They hired more staff and bought new equipment. These actions helped hospitals treat patients faster and cut waiting lists.
What is the difference between waiting times and waiting lists?
Waiting times measure how long a patient waits for care.
Waiting lists count the number of people waiting for treatment.
Both show how well the NHS meets patient needs.
See Also
Evaluating NHS Waiting Periods Under Labour And Conservative Rule
Analysing NHS Funding Commitments From Labour And Conservatives
Is There Progress In Reducing NHS Waiting Times?
Reasons NHS Waiting Lists Will Persist Despite New Government